
Trace motor-vehicle supply chains
An EXIOBASE case study of CO2 paths serving German final demand for motor vehicles.
Input · EXIOBASE 3.10.1, product-by-product IOT, 2022, with emissions. Question · Which production paths contribute to the selected German final-demand bundle’s combustion CO2 footprint?
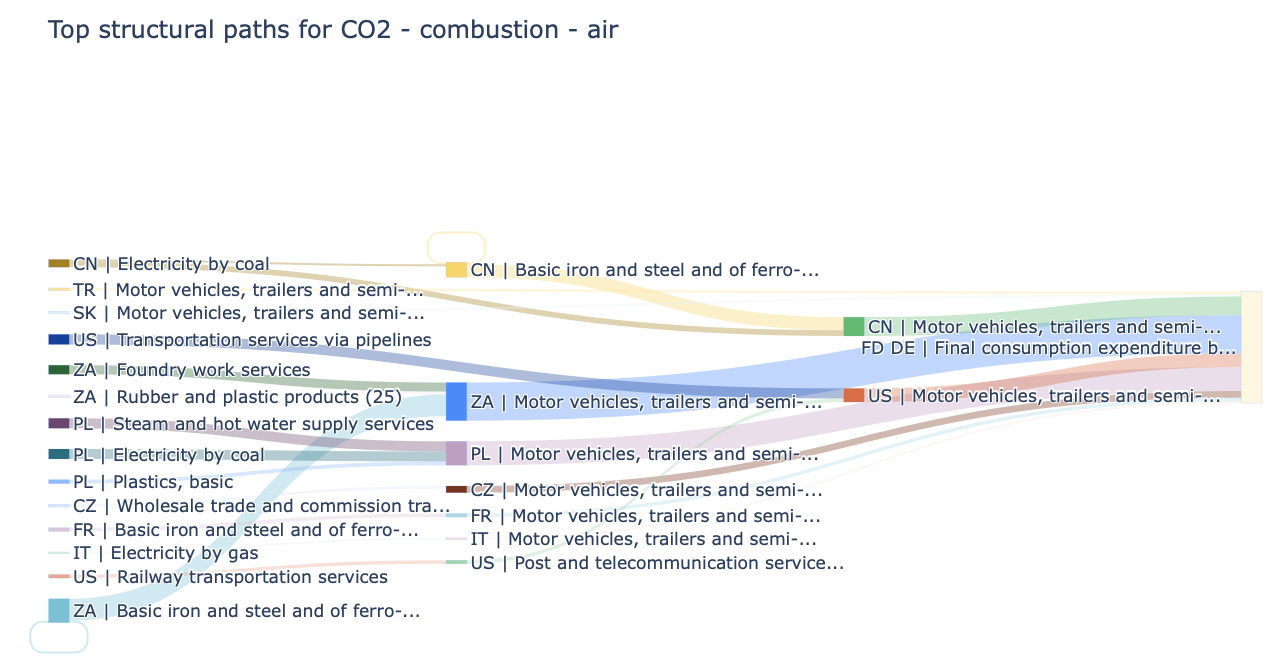
Example output from the companion notebook. Only retained paths are shown; the plot is not the complete footprint.#
Analysis steps#
1 · Select demand
Parse IOT_2022_pxp.zip. Select Motor vehicles, trailers and
semi-trailers (34) and rank its German final-demand categories.
The notebook chooses the largest non-zero bundle.
2 · Set the threshold
Calculate the bundle’s total footprint first. The example sets the pruning threshold to 0.1% of its absolute value and explores at most ten upstream rounds.
3 · Trace and inspect
spa = db.calc_spa(
    indicator="CO2 - combustion - air",
    item=SECTOR, final_demand_region=FOCUS_REGION,
    final_demand_category=FOCUS_CATEGORY,
    max_depth=10, cutoff=CUTOFF, top_n=20,
    plot="sankey", show_plot=True,
)
spa.attrs["coverage_share"]
The notebook defines the selectors and CUTOFF in the preceding steps.
Compare reported contribution with the full bundle total.
Compare paths with the depth summary
Repeat with top_n=None and plot="depth" to group retained
contributions by upstream round. This removes the returned-row cap, but
depth and pruning limits still apply.
For a small runnable example, output definitions and limitations, start with Structural path analysis.